
World in Conflict
Publisher: SierraWe regard World in Conflict as one of the best real-time strategy games we've ever played. It's based on Microsoft's DirectX 10 API and, in collaboration with Nvidia's The Way It's Meant To Be Played developer support team, it incorporates some DirectX 10 specific graphics effects.
The first of these is a soft particle effect that removes the banding often found in particle effects like smoke, explosions, fire and debris - the effects simply didn't exist in the 3D world; instead, they were merely an add-on. With DirectX 10, the edges of the particle effects are much softer and banding is almost non-existent as the effects now interact with their 3D surroundings, as they're actually a part of the 3D world.
Additionally there are global cloud shadowing and volumetric lighting effects in the DirectX 10 version of the game. The latter is often referred to as 'god rays' and its implementation in World in Conflict interacts with the surroundings incredibly well. On the other hand, the former is where clouds cast shadows on the rest of the environment and, because all clouds in World in Conflict are volumetric and dynamic, the shadows cast by the clouds are rendered dynamically in DirectX 10 - they adjust in relation to the size, shape and orientation of the cloud in relation to the light source.
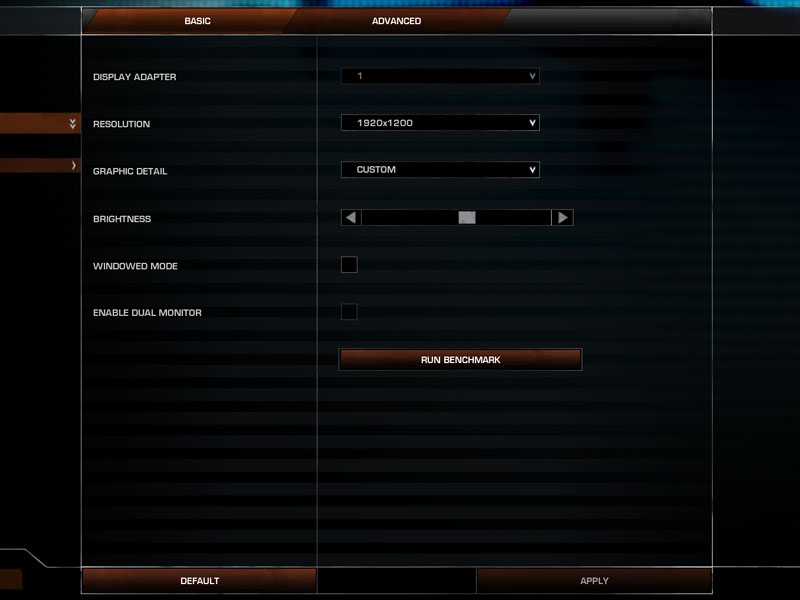
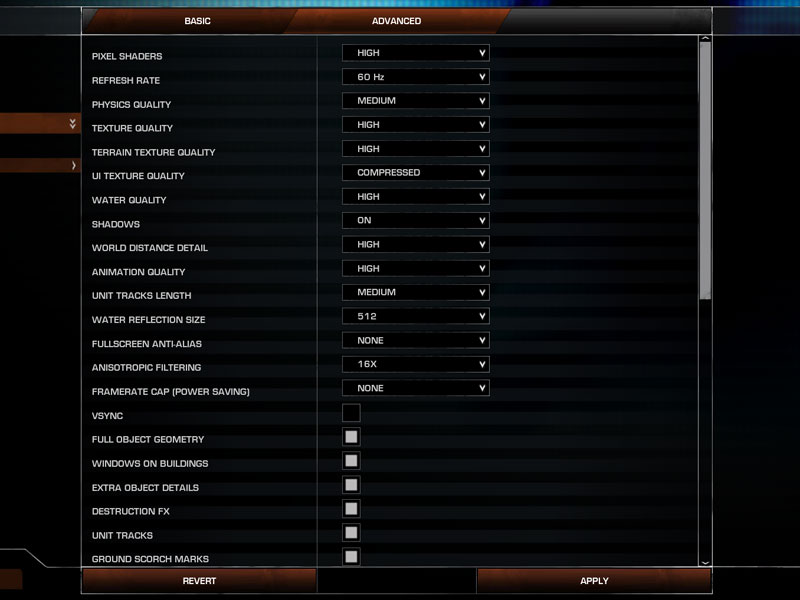
For our testing purposes, we used a full retail copy of the game and patched it to version 1.007, which includes a few fixes and some improved performance under DirectX 10. We used a manual run through from the Invasion level, which incorporates all of the effects we've discussed above. We chose not to use the built-in benchmark because it's largely CPU-limited. We used the "very high" preset, and controlled Anti-Aliasing and Anisotropic Filtering via the advanced settings tab.
As resolution increases, BFG's GeForce GTX 260 OCX Maxcore extends its lead over the reference-clocked GeForce GTX 260 with 192 stream processors, but at the same time starts to fall away from Nvidia's flagship GeForce GTX 280. This is a test where the Radeon HD 4870 X2 doesn't scale particularly well, so there are some instances where the GTX 280 is out in front while the X2 is busy fighting against the GTX 260 OCX Maxcore.
Unlike the standard GTX 260, the Maxcore is able to hold off the challenge from AMD's ATI Radeon HD 4870 all the way up to 2,560 x 1,600.
RELATED ARTICLES


MSI MPG Velox 100R Chassis Review
October 14 2021 | 15:04

Want to comment? Please log in.