
Texture Sampling
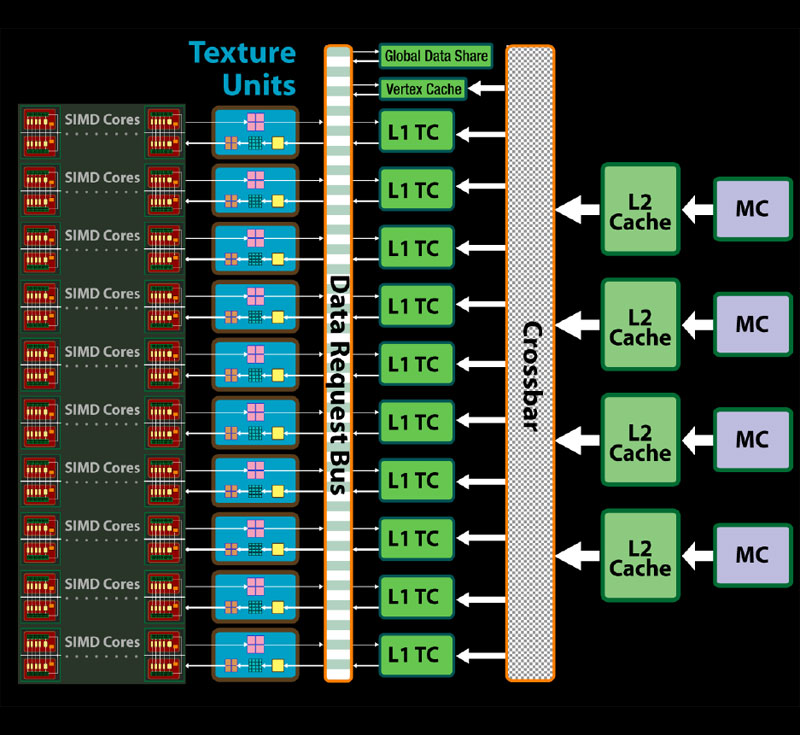
I mentioned earlier that AMD has changed its texturing architecture slightly and has moved away from completely decoupled texture samplers to aligning them with SIMD cores. AMD has also spent quite a bit of time talking about how it has put the design on a diet, making better use of die space – the texture units are another area where this has been one of the goals.The company said that, in its own tests, it managed to increase texturing performance per mm² by a whopping 70 percent – that’s a pretty significant advancement, but it’s not all down to just shrinking RV670’s texture units by 70 percent. In fact, AMD didn’t say by how much it’d reduced the texture units’ die space, but it did mention that it has improved the units in a number of areas.
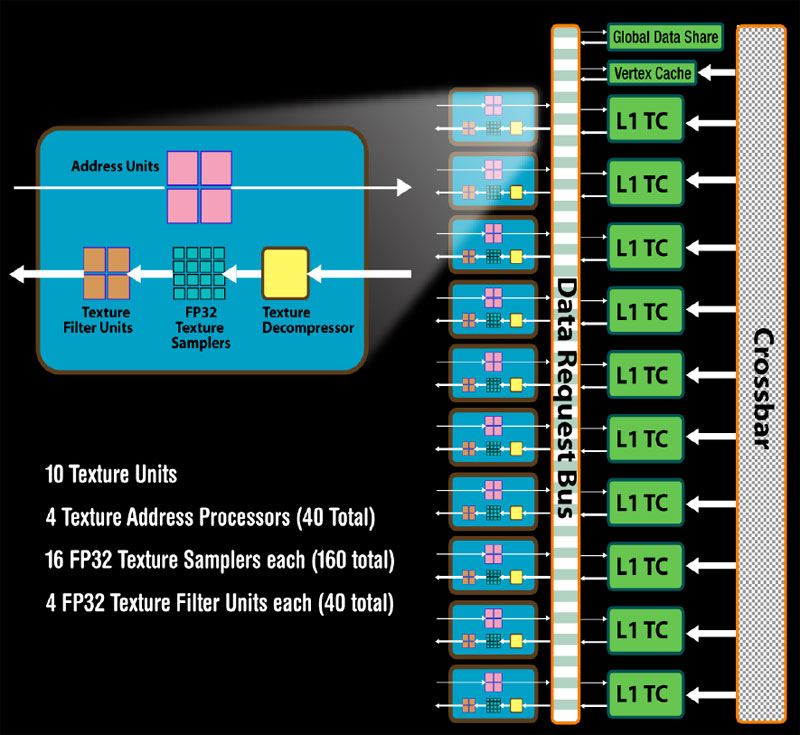
Each of the ten texture units can handle four addresses, 16 FP32 samples and four FP32 filters per clock. When all of this is added up, AMD says that it has increased the FP32 filter rate by two and a half times, while the FP64 filter rate has increased by one and a quarter times. Texture cache bandwidth has been increased by a factor of two over RV670, while the chip can fetch up to 160 textures per clock.
There have also been some quite significant changes to the texture cache design too, with each texture unit having its own independent L1 texture cache. This allows each L1 to store data that is unique to the SIMD it is aligned with, making for more efficient use of the storage space available. Although AMD hasn’t been specific about the L1 texture cache’s size, it did say that it had doubled the storage space (per L1) which equates to a five-fold increase chip-wide.
Click to enlarge
There’s also a dedicated vertex texture cache as well, and this can be addressed by any of the SIMD cores via the data request bus. In addition, the L2 texture cache design has been completely realigned too – although this is mainly because AMD has changed its memory architecture (we’ll come to that shortly), but the basic gist of it is that RV770’s texture caches are now assigned to memory channels. There are four memory channels, and each memory channel has its own L2 texture cache.
Because of the redesigned cache architecture, AMD decided that texture fetch bandwidth needed to be increased as well; there’s now up to 480GB/sec available if only using L1 texture caches, while there’s up to 384GB/sec of bandwidth available between the L1 and L2 caches. Let’s have a look at how this translates into performance...
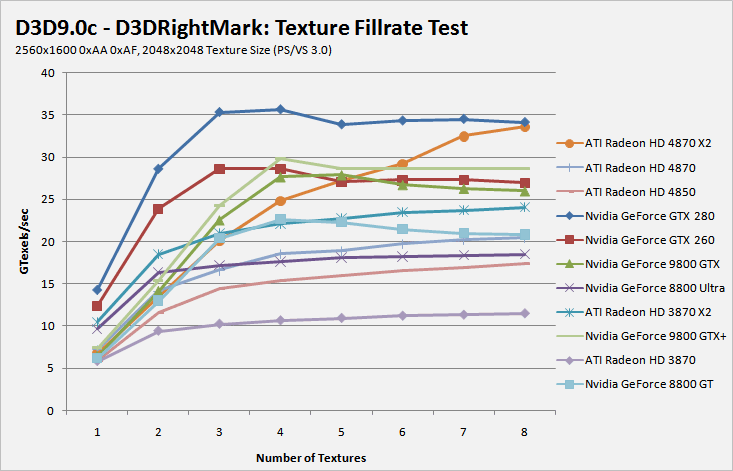
When it comes to multi-texturing efficiency, it's hard to beat Nvidia's relentless work in this area - the company massively improved efficiency and that enabled it to get closer to peak than ever before. AMD has made some telling improvements now though, because there are actually enough texture units available now for this part of the chip to not become a bottleneck in today's games. These improvements really come to light in the 3DMark Vantage texture fillrate test, where both the Radeon HD 4870 and 4850 put up a strong fight on land normally dominated by Nvidia.
RELATED ARTICLES


MSI MPG Velox 100R Chassis Review
October 14 2021 | 15:04

Want to comment? Please log in.