Euler3D
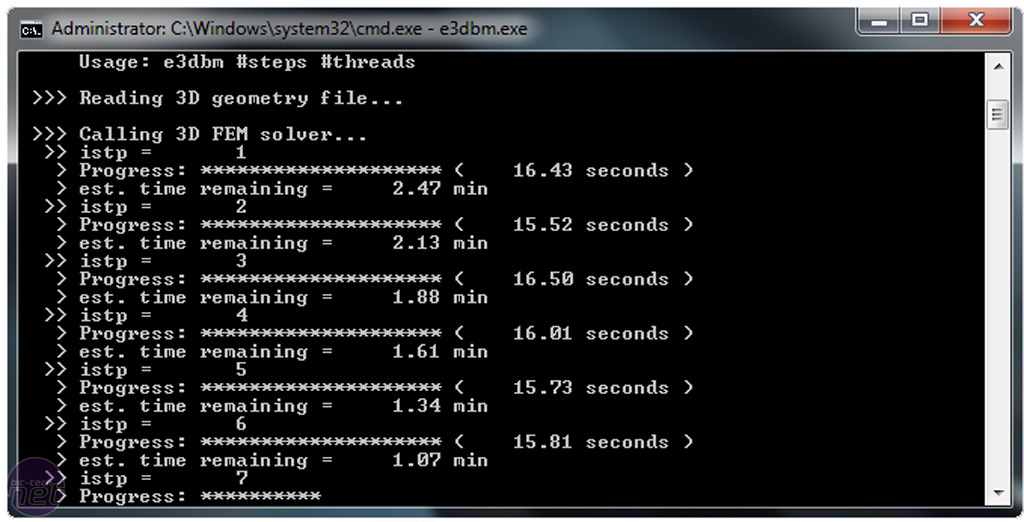
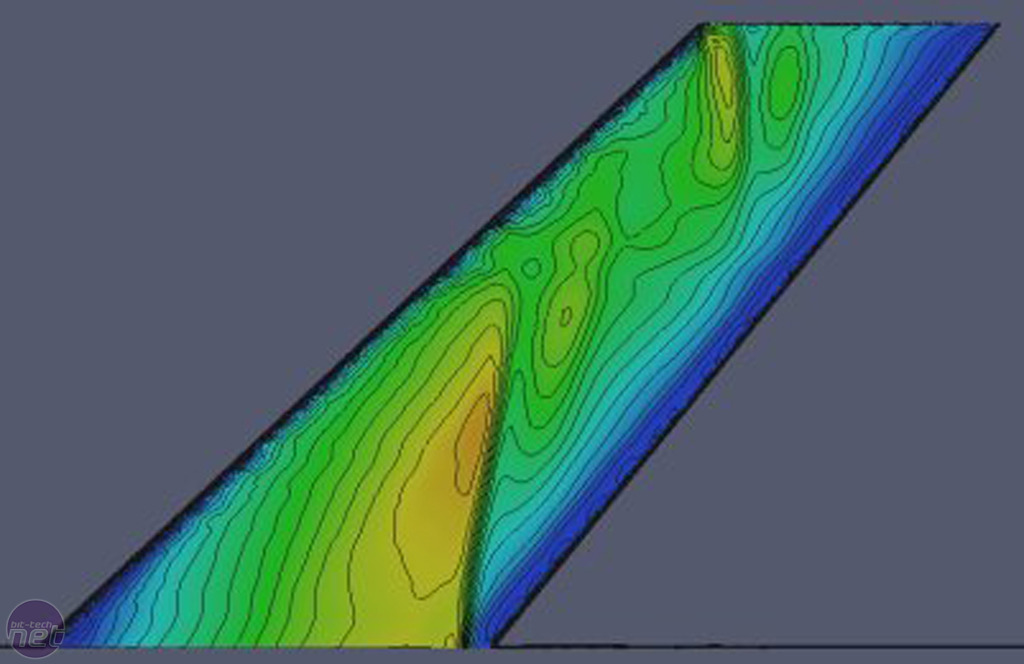
Website: Euler3DWe also ran the Euler3D HPC benchmark from the CASE lab at Oklahoma State University. This benchmark analyses airflow over a section of the wing of an aircraft in a virtual wind tunnel travelling at Mach 0.5 (half the speed of sound) using CFD (computational fluid dynamic) calculations.
Euler3D presents its results expressed as a CFD cycle frequency in hertz, so a higher number is better.
For an explanation of what these numbers mean, head to the Performance Analysis page.
Power Consumption
For all of the performance tests, we disable all power saving technology in order to give us a consistent set of results, and also best-case performance numbers - even though technologies such as Intel's SpeedStep might only take microseconds to kick in, that can make a difference in some tests.
However, for the power consumption tests we re-enable everything in order to get a real-world power draw. The power draw is measured via a power meter at the wall, so the numbers below are of total system power draw from the mains, not the power consumption of a CPU itself. Measuring the power draw of any individual component in a PC is tricky-to-impossible to achieve.
Idle Power Consumption
For this test, we leave the PC doing nothing but displaying the Windows 7 desktop (with Aero enabled) for a few minutes and record the wattage drawn from the wall via a power meter.
For an explanation of what these numbers mean, head to the Performance Analysis page.
Load Power Consumption
For this test, we want to only stress the CPU, so use the smallfft stress test of Prime95 to fully load all available processors (logical as well as physical). We leave Aero enabled, and wait a few minutes for any power saving technology to kick in and for the power consumption to level out before taking our reading.
For an explanation of what these numbers mean, head to the Performance Analysis page.
RELATED ARTICLES


MSI MPG Velox 100R Chassis Review
October 14 2021 | 15:04

Want to comment? Please log in.