AMD FX-8150 Overclocking and Performance
With a poor set of stock-speed performance results, we set about overclocking the CPU. We were interested to see what we could squeeze from its Bulldozer architecture given that it’s been designed for high frequencies. The AMD guideline on overclocking an FX-8150 is that 4.6GHz is easy on air and that 4.9GHz is achievable under water. If you’re chasing CPU frequency, these numbers increase by 300-400MHz as you’d only be running one Module rather than all four.Before we dive in, a quick note on memory: our FX-8150 was very fussy with its memory. It refused to overclock unless the memory was in Slots A1 and B1, which on the Crosshair V Formula are the two red slots.
We initially used just the CPU multiplier to overclock, but there appeared to be a hole at 4.8GHz where the CPU just refused to play ball. Switching to a touch of HTT overclocking to achieve 4.818GHz (with a HTT of 205MHz and a CPU multiplier of 23.5) produced a perfectly stable system. We applied 1.45V to the CPU, 1.2V to the CPU/NB, 1.2V to the Northbridge, 1.25V to the NB HT and used the default 1.65V for our memory despite it running at 1,612MHz CL9 rather than the rated 1,600MHz CL9.
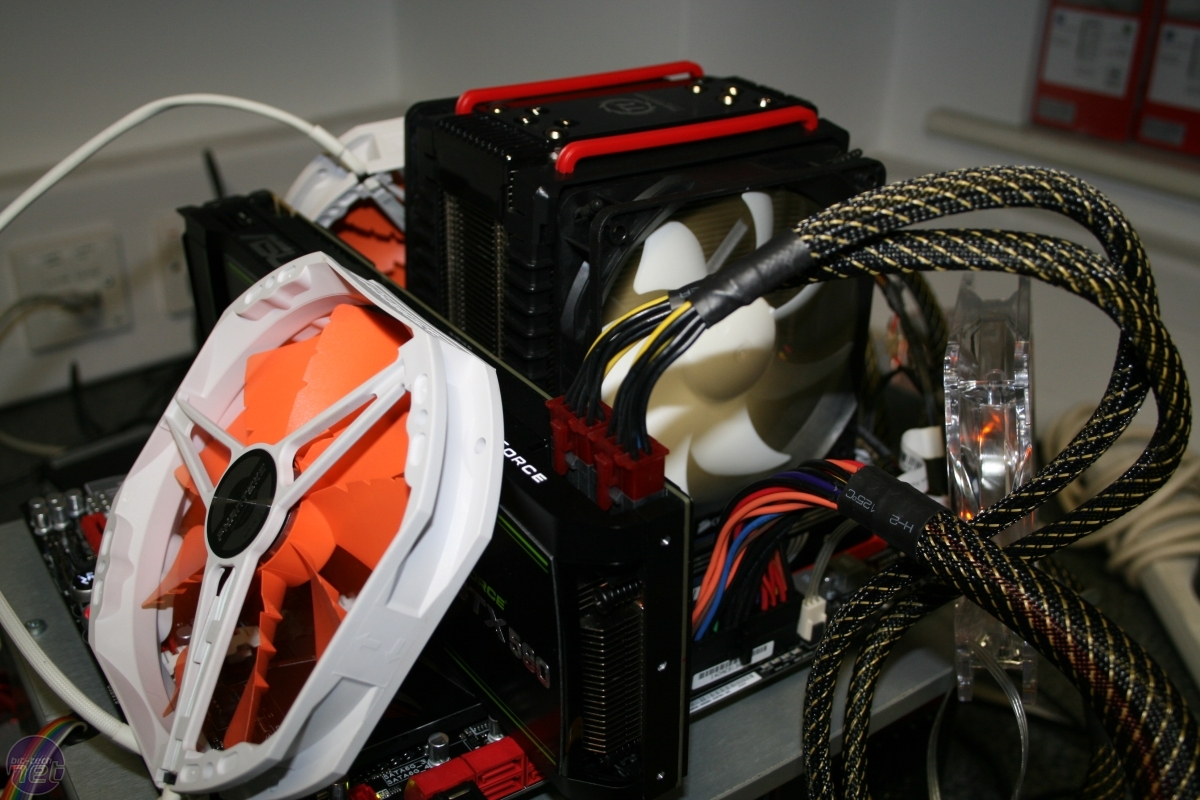
Overclocking requires plenty of cooling
Usually with CPUs, increasing the system bus (in this case, the HTT) will produce more performance for the same CPU frequency, so we went back into the BIOS to increase the HTT to 242MHz and drop the CPU multiplier to 20x. This meant that our CPU was running at 4.84GHz rather than 4.818GHz , and also meant that the memory was running at 1,640MHz CL9. However, despite more CPU frequency, system-to-CPU bandwidth and slightly more memory bandwidth, some benchmark results actually decreased even if a few increased slightly. We used the set of results that were produced with the first overclock (23.5 x 205MHz) as the official results, but both were faster in four of the eight tests we could run.
We should have been able to push the FX-8150 to 5.1GHz, but unfortunately core 7 wasn’t up to the task. Even so, an overclock of 3.6GHz to 5.1GHz isn’t as stellar as we’d hoped given that Bulldozer is designed for high frequencies as it represents an increase of 42 per cent, much better than the 27 per cent frequency boost we managed with the Phenom II X6 1100T.
However, compare the FX-8150 overclock to the 5GHz overclocks we achieved with the two Sandy Bridge CPUs – increases of 52 and 47 per cent – and it’s clear to see that it doesn’t deliver phenomenal frequency scaling. This could turn out to be a problem for AMD, as its strategy with Bulldozer is ramp up the frequency to deliver the performance per second to compete with Intel’s IPC (instructions per clock).
Overclocked Performance Analysis
While our overclocking efforts produced a significant boost for the FX-8150 in every test and application, the two rival Sandy Bridge CPUs also gained masses of performance after their hefty overclocks. While the FX-8150 at least managed to overhaul the Core 2 Duo E670o in the image editing test with a score of 1,077, the 5GHz Core i5-2500K was over twice as fast with a score of 2,228.At 4.818GHz the FX-8150 was faster than a stock speed Core i5-2500K in our video encoding test, but was around 800 points behind that CPU operating at 5GHz. At least the FX-8150 managed to keep ahead of the Core i7-920 when both were overclocked, if only by 65 points.
However, the 4.818GHz FX-8150 dropped back to second-last place in the multi-tasking test and overall – the Core i7-920 managed to overhaul its deficiencies in both tests thanks to its 4.04GHz overclock. This left the Core i5-2500K and Core i7-2600K way ahead of the FX-8150, with 2,662 and 2,791 points overall respectively, rather than 1,860.
When overclocked, the FX-8150 was on par with the overclocked Core i5-2500K and Core i7-920 in WPrime, a poor result considering AMD’s claims that it’s an 8-core CPU while the Core i5 is quad-core and the i7-920 invents four of its threads thanks to Hyper-Threading. The FX-8150 also failed to overtake the Core i7-2600K in Cinebench R11.5 when both were overclocked, managing just 7.95 points rather than 9.78.
Even in the one game that the FX-8150 could run without catastrophic failure and a system re-boot, it was lacking speed with a minimum of 70fps in Arma II. That’s slower than the Core i5-2500K at stock speed (which managed a minimum of 86fps) and only 1fps faster than the Phenom II X6 1100T operating 618MHz slower.
Power Consumption
While the FX-8150 maintained its excellently low idle power even when aggressively overvolted – the 126W it drew from the wall was less than even a similarly aggressively overclocked Sandy Bridge system – the load power consumption rocketed to 586W. That’s a phenomenal amount of energy, especially considering the low levels of performance produced.Taking the overall score from our Media Benchmarks, and yet another fag packet to do some kludgey maths, the FX-8150 produces a figure of 6.41 points/W (taking the peak power consumption under load) at stock speeds and of 3.17 points/W when overclocked. However, the Core i5-2500K delivers 13.06 points/W at stock speed and 8.56 points/W when overclocked; the Intel CPU is clearly much more efficient. Cinebench – which will cause 100 per cent load for its score – corroborates this Fermi-esque logic (that’s the scientist and mathematician Enrico Fermi, not the graphics architecture). For the graph, we multiplied all the Cinebench efficiency scores by 100 to help our axes.


MSI MPG Velox 100R Chassis Review
October 14 2021 | 15:04

Want to comment? Please log in.