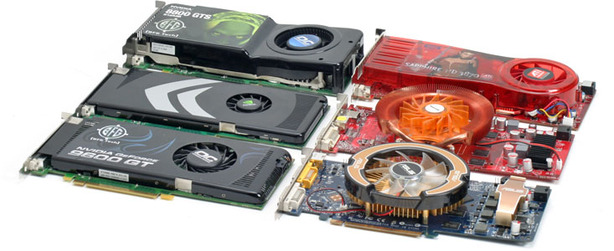
Performance Mainstream Graphics Update
Just last week, Nvidia launched its GeForce 9600 GT 512MB graphics card and we found that the card performs pretty well, but it needs to hit the right price point. Our initial testing was completed on a machine with relatively modest specifications by today's standards, because we felt it was important to represent a typical mid-range system.Today, we're exploring the GeForce 9600 GT's performance with a higher-end system and comparing it to the products that are priced in close proximity to it. When we started to put this article together, we were hoping to answer another question that cropped up during our early G94 testing: how does the GeForce 9600 GT stand up to the GeForce 8800 GT 512MB and Radeon HD 3870 512MB cards in more shader-intensive scenarios?
With that in mind, we used our standard high-end test system to obtain performance results over a range of games at high quality settings. Before we get onto our system configuration though, it's worth having a look at the performance mainstream pricing matrix across the UK's top computer component resellers – all pricing is correct at the time of publication.
| Retailer | Nvidia GeForce 8800 GS 384MB | Nvidia GeForce 9600 GT 512MB | Nvidia GeForce 8800 GT 512MB | ATI Radeon HD 3850 512MB | ATI Radeon HD 3870 512MB |
| Scan | £109.62 (£99.82 OEM) | £120.48 (£117.45 OEM) | £146.63 | £117.49 (£101.90 OEM) | £130.43 (£124.32 OEM) |
| Ebuyer | £109.98 | £119.98 | £148.99 | £101.64 | £120.68 |
| Overclockers | N/A | £109.26 | £146.86 (£135.11 OEM) | £99.86 (£97.51 OEM) | £116.31 (£110.44 OEM) |
| Micro Direct | £111.16 | £113.98 (£107.87 OEM) | £153.81 (£134.30 OEM) | £121.73 (£106.10 OEM) | £142.76 |
| Dabs | £109.60 | £118.33 | £153.09 (£149.97 OEM) | £118.44 | £140.24 |
| Aria | £109.22 (£103.34 OEM) | £136.01 (£116.27 OEM) | £155.04 (£145.64 OEM) | £118.38 (£105.69 OEM) | £137.06 (£133.66 OEM) |
| Average low price (inc. OEM) | £107.53 | £117.38 | £146.94 | £108.87 | £128.43 |
| Average low price (exc. OEM) | £109.92 | £119.14 | £150.74 | £112.92 | £131.25 |
GeForce 9600 GT pricing—at least at the bottom end of the spectrum—has settled down a bit over the past few days and, on average, the GeForce 9600 GT is around £30 (or 20 percent) cheaper than the GeForce 8800 GT 512MB. Based on the performance data from our original G94 architectural review, the standard-clocked GeForce 9600 GT 512MB looks to be a good option for consumers.
As games become more shader intensive though, the likelihood is that the GeForce 9600 GT will fall further behind the GeForce 8800 GT than it is today. While we can't test the GeForce 9600 GT in a bunch of tomorrow's games, we can increase the in-game quality settings in current games to increase shader load, hopefully giving us an indication of where performance might lie in future titles—or at the very least, at higher quality settings in current games.
Test Setup
As always, we did our best to deliver a clean set of benchmarks, with each test repeated three times and an average of those results is what we’re reporting here. In the rare case where performance was inconsistent, we continued repeating the test until we got three results that were consistent.Nvidia Test System
- Nvidia GeForce 9600 GT 512MB – operating at 650/1,625/1,800MHz using Forceware 174.12 beta
- Nvidia GeForce 8800 GT 512MB – operating at 600/1,500/1,800MHz using Forceware 169.28 beta
- Nvidia GeForce 8800 GS 384MB – operating at 550/1,375/1,600MHz using Forceware 169.32 WHQL
- BFGTech GeForce 8800 GTS 512MB – operating at 675/1,674/1,940MHz using Forceware 169.28 beta

ATI Test System
- ATI Radeon HD 3870 512MB – operating at 775/2,250MHz using Catalyst 8.1 WHQL (8-451-071220a1)
- PowerColor Radeon HD 3850 512MB Xtreme PCS – operating at 720/1,800MHz using Catalyst 8.1 WHQL (8-451-071220a1)
Games Tested
We used the following versions of the games listed to evaluate the performance of these video cards:- Crysis, version 1.1.1.5879 (patch 1.1) with DirectX 10 and DirectX 9.0
- Call of Duty 4: Modern Warfare version 1.4 with DirectX 9.0
- World in Conflict, version 1.005 with DirectX 10
- BioShock, version 1.1 with DirectX 10
- Unreal Tournament III, version 1.1 with DirectX 9.0
- Enemy Territory: Quake Wars, version 1.4.0

MSI MPG Velox 100R Chassis Review
October 14 2021 | 15:04


Want to comment? Please log in.