Testing and Scoring Methods
How we test
For testing power supplies, we use professional Stratron load generators, which allow us to simulate a load of up to 1,600 watts on PSUs in our test lab. We test each PSU in increments of 100 watts, up to the maximum load. At each step we measure the voltages on the different lines. The closer those measurements are to the official values of 3.3V, 5V and 12V, the better. A deviation greater than 5 per cent means the PSU does not meet the criteria dictated by the ATX specification. For the all important 12V rail, we take two measurements. 12V1 is the PSU's 12V connection with the lowest reading for each test setting, while 12V2 refers to the connection with the highest. As voltage output falls under heavier loads, 12V1 is the more crucial of the two.At each step we also measure the current from the socket with a professional Zes Zimmer ammeter. Based on this we calculate the efficiency. This is the percentage of power drawn from the wall socket that is actually delivered to the PC’s components. If components use a total of 400W, a system with an 80 percent efficient PSU uses 400 / 0.80 = 500W. The same PC with a 90 percent efficient PSU only draws 400 / 0.90 = 444W. It can potentially make a difference to your energy bill in the long term, but it also impacts other areas. The wasted capacity is turned into heat, so the more efficient the PSU, the cooler it stays and the less additional cooling you need, which improves the lifespan of the components within.
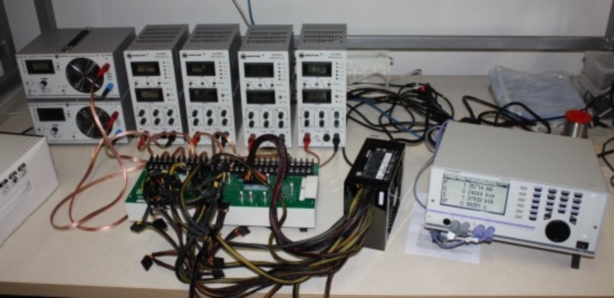
Our test set-up
Using an oscilloscope we can also measure the ripple/noise, which refers to the fluctuations in the direct current (DC) output of a power supply that happens as a result of its conversion from alternating current (AC). If this fluctuation occurs at low frequency, then it is referred to as ripple, while at high frequency it's called noise. It's an arbitrary distinction, and in both cases lower is better, and the more stable the power supply is. In particular, overclockers wanting to push their system to the limit benefit from a very low ripple. We measure the maximum ripple of the 12V line at each step. The Vpp (voltage peak-to-peak) values indicate the difference between the highest and lowest recorded voltages. Values around 50 mVpp are excellent and ensure that you don't need to worry even during extreme overclocking. Values below 75 mVpp are still very good. However, if a power supply is far above that level, that is a real negative, and values above 120 mVpp (on the 12V line) are in breach of Intel's ATX PSU specifications and will endanger your components in the long run too.
It should be noted that in all cases we draw 50 watts of current from the 3.3V and 5V lines, and the rest from the 12V lines. This is different to how the 80 Plus initiative or most manufacturers themselves test their power supplies, whereby rails are loaded proportionally based on their individual rated maximum current, but is closer to real-world performance. In a PC, all energy-consuming components (mainly the CPU and GPU) only utilise the 12V lines, and the 3.3V and 5V lines these days have a very limited role.
We have recently started taking measurements at 22.5, 50 and 100 watts, in addition to the standard tests starting at 200 watts. These values and the way in which the load is divided over the 3.3V, 5V and 12V rails are both based on a real system featuring an Intel Core i7-4770K CPU, a Gigabyte GA-Z87X-UD3H motherboard, two Corsair Vengeance Pro memory modules, an OCZ Vertex 4 SSD and a CPU cooler. The 22.5 watt test roughly simulates the system's idle usage, the 50 watt test simulates a scenario where one CPU core is fully loaded, and the 100 watt test simulates a scenario where all cores are fully loaded.
In addition to measurements with load, we also measure the current drawn from the socket without any load – it is important to know how much leakage current a power supply has.
For the measurement of noise levels we test power supplies in a sound-proof box, so we can accurately register levels as low as 18 dB(A). We place our sound meter at a distance of 10cm from the power supply, on which we put loads of 100W, 300W and 500W.
How we score
The voltage stability tests take pride of place in the scoring box and accounts for 40 percent of each PSU's overall score. The score is worked out as a percentage of the voltage measurements that are within the limits of Intel's specifications. We only recommend that you buy a PSU with 100 percent stability.The Design score factors in the average efficiency across each of the load scenarios (as well as low load efficiency measurements and the leakage level under no load), the highest amount of ripple exhibited by the PSU and the amount of noise it produces. As well as this, it also incorporates the number, type and quality of cables supplied with the unit. Finally, the Value score is simply a combination of the Stability and Design scores and the total rated output (in watts) divided by the price.


MSI MPG Velox 100R Chassis Review
October 14 2021 | 15:04

Want to comment? Please log in.