PowerColor Radeon RX 6700 XT Hellhound Review
March 24, 2021 | 14:31
Companies: #amd #powercolor #radeon
Test Setup
Our GPU test rig uses Intel's Z370 platform. Specifically, we use the Asus ROG Maximus X Hero paired with an Intel Core i9-9900K. With eight cores and 16 threads via Hyper-Threading, the CPU ensures even the most multi-threaded games won't be bottlenecked, and we've overclocked it to 4.9GHz as well with a base clock of 100MHz, a multiplier of 49, and a vcore of 1.315V, further alleviating CPU bottlenecks. The CPU is paired with 32GB (4 x 8GB) of Corsair Vengeance RGB DDR4 clocked at 3,200MHz and cooled by a Corsair Hydro Series H115i Pro RGB.
The rig is powered by the Corsair AX1500i, which has enough wattage and eight-pin PCIe power connectors to deal with any multi-GPU set-up we care to throw at it. It's all housed inside a Corsair Carbide Series Air 740, which is spacious enough for any card. The final component is a Corsair Force Series MP510 960GB PCIe 3.0 x4 M.2 SSD, giving us plenty of space for game installs and keeping load times down.
Our results come from a mix of built-in benchmarks and custom, manually played sections, depending on the game. All game benchmarks are repeated at least three times to ensure consistency. We test at 1,920 x 1,080 (1080p), 2,560 x 1,440 (1440p), and 3,840 x 2,160 (4K), though some resolutions are excluded if they are deemed inappropriate for a certain card. The operating system is an up-to-date copy of Windows 10 64-bit.
As well as the average frame rate, we report the 99th percentile frame rate that is a better representation of the "minimum" frame rate in terms of experience than the single slowest frame of the entire benchmark. Obtaining this figure involves using software (currently OCAT - the Open Capture and Analytics Tool) to record the render time of every single frame in a benchmark, meaning poor performance has nowhere to hide. Such software typically gives you a 99th percentile frame time in milliseconds. Dividing 1,000 by this figure converts it into a frame rate measurement.
The test system is being overhauled in the next two months to provide newer games and a more up-to-date comparison list.
Test System
- CPU Intel Core i9-9900K at 4.9GHz (49 x 100MHz)
- Motherboard Asus ROG Maximus X Hero
- Memory 4 x 8GB Corsair Vengeance RGB 3,200MHz DDR4
- PSU Corsair AX1500i
- SSD Corsair Force Series MP510 960GB
- Case Corsair Carbide Series Air 740
- CPU cooler Corsair Hydro Series H115i Pro RGB
- Operating system Windows 10 64-bit
AMD Graphics Cards
- Sapphire Radeon RX 6800 XT Nitro+ - 2,015MHz GPU (2,360MHz boost), 16Gbps GDDR6 (Radeon Software Adrenalin 20.50)
- Sapphire Radeon RX 6800 Nitro+ - 1,815MHz GPU (2,190MHz boost), 16Gbps GDDR6 (Radeon Software Adrenalin 20.50)
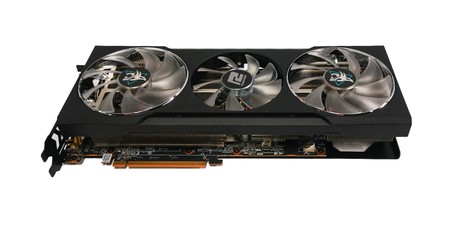
- PowerColor Radeon RX 6700 XT Hellhound - 2,424MHz GPU (2,581MHz boost), 16Gbps GDDR6 (Radeon Software Adrenalin 20.50)
- PowerColor Radeon RX 5700 XT Red Devil - 1,770MHz GPU (2,010MHz boost), 14Gbps GDDR6 (Radeon Software Adrenalin 20.50)
Nvidia Graphics Cards
- MSI GeForce RTX 3080 Gaming X Trio - 1,815MHz boost, 19Gbps GDDR6X (GeForce 456.16)
- Nvidia GeForce RTX 2080 Founders Edition - 1,515MHz GPU (1,800MHz boost), 14Gbps GDDR6 (GeForce 456.16)
- Aorus GeForce GTX 1080 Ti Xtreme Edition 11GB - 1,607MHz GPU (1,721MHz boost), 11.2Gbps GDDR5X (GeForce 456.16)
RELATED ARTICLES


MSI MPG Velox 100R Chassis Review
October 14 2021 | 15:04

Want to comment? Please log in.