Power Consumption (Idle and Gaming)
In order to get an idea of a GPU's power draw, we loop the Unigine Valley 1.0 benchmark (2,560 x 1,400, 'Ultra' detail, no anti-aliasing), which is a very GPU-limited test. We use a watt meter to measure the maximum total system power draw during the test, and also take an idle reading at the Windows desktop (3,840 x 2,160).
-
Gigabyte GeForce GTX 1060 WindForce OC 3GB
-
Aorus GeForce GTX 1060 9Gbps 6GB
-
Gigabyte GeForce GTX 1060 G1 Gaming 6GB
-
Sapphire Radeon RX 470 Nitro+ OC 4GB
-
Sapphire Radeon RX 480 Nitro+ OC 4GB
-
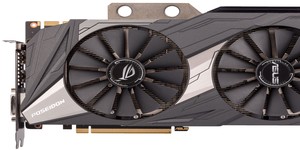
Asus GeForce GTX 1080 11Gbps Strix OC 8GB
-
Aorus Radeon RX 570 4GB
-
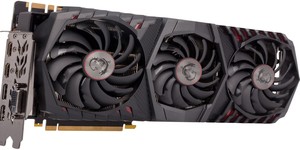
MSI Radeon RX 570 Gaming X 4GB
-
Palit GeForce GTX 1070 GameRock Premium Edition 8GB
-
Sapphire Radeon RX 480 Nitro+ OC 8GB
-
Asus Radeon RX 580 Strix Gaming Top OC 8GB
-
EVGA GeForce GTX 1080 FTW 8GB
-
Sapphire Radeon RX 580 Nitro+ 8GB
-
Aorus GeForce GTX 1080 11Gbps 8GB
-
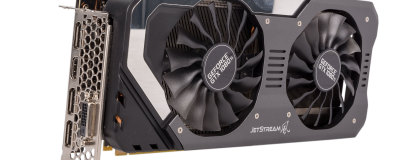
Palit GeForce GTX 1080 Ti Super JetStream 11GB
-
Nvidia GeForce GTX 1080 Ti Founders Edition 11GB
-
Nvidia Titan X Pascal 12GB
-
MSI GeForce GTX 1080 Ti Gaming X 11GB
-
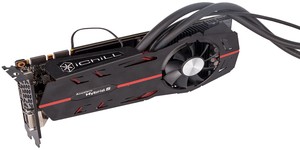
AMD Radeon R9 Fury X 4GB
-
Aorus GeForce GTX 1080 Ti 11GB
System Power Draw in Watts (lower is better)
Thermal Performance (Idle and Gaming)
Thermal output is also measured using Unigine's Valley 1.0 benchmark. The GPU is installed in a closed, but fairly well ventilated case (Corsair Graphite 760T) with HDD cages removed and the case fans at full speed. We leave all GPU fan profiles and settings as they come and leave the benchmark running for ten minutes so that temperatures plateau. We record the peak GPU temperature using GPU-Z, and present the data as the delta T (the difference between the GPU temperature and the ambient temperature in our labs). We also take an idle reading at the Windows desktop (3,840 x 2,160).
-
AMD Radeon R9 Fury X 4GB
-
Asus GeForce GTX 1080 11Gbps Strix OC 8GB
-
Gigabyte GeForce GTX 1060 G1 Gaming 6GB
-
Aorus GeForce GTX 1060 9Gbps 6GB
-
Aorus GeForce GTX 1080 11Gbps 8GB
-
Asus Radeon RX 580 Strix Gaming Top OC 8GB
-
Palit GeForce GTX 1070 GameRock Premium Edition 8GB
-
Aorus Radeon RX 570 4GB
-
MSI Radeon RX 570 Gaming X 4GB
-
Palit GeForce GTX 1080 Ti Super JetStream 11GB
-
Aorus GeForce GTX 1080 Ti 11GB
-
MSI GeForce GTX 1080 Ti Gaming X 11GB
-
Gigabyte GeForce GTX 1060 WindForce OC 3GB
-
Sapphire Radeon RX 480 Nitro+ OC 4GB
-
Sapphire Radeon RX 480 Nitro+ OC 8GB
-
EVGA GeForce GTX 1080 FTW 8GB
-
Sapphire Radeon RX 580 Nitro+ 8GB
-
Sapphire Radeon RX 470 Nitro+ OC 4GB
-
Nvidia Titan X Pascal 12GB
-
Nvidia GeForce GTX 1080 Ti Founders Edition 11GB
Delta T in °C (lower is better)


Want to comment? Please log in.